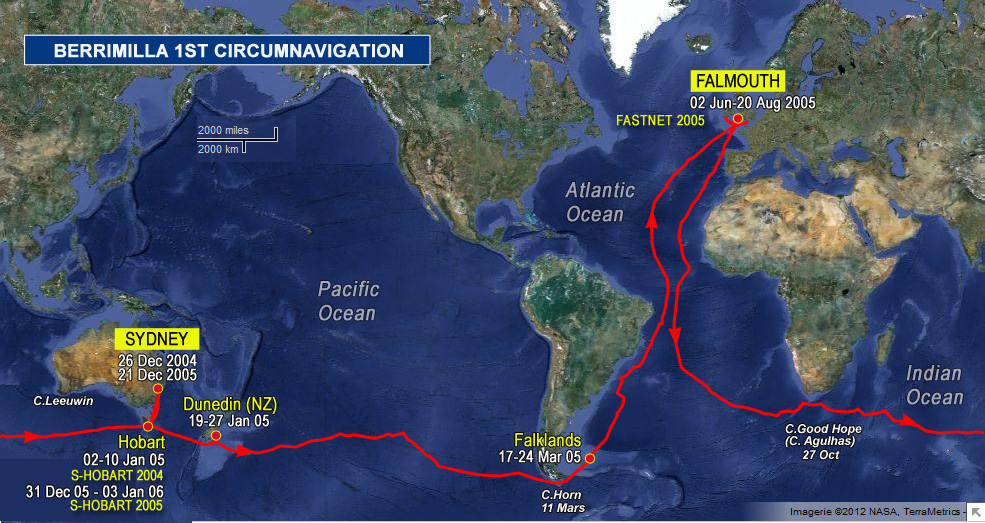
1530hrs 15 May 2005 UTC 22’36”N 035’25”W Map Ref 220 5237nm (2180nm to Falmouth)
Here’s a project for someone with time to spare. In the days of square riggers trying to minimise their costs, the shipping companies, especially the Germans, compiled statistical charts showing the data from the logs of thousands of voyages out from Europe via the Horn and the Cape of Good Hope to Australia, San Francisco, Hong Kong and just about everywhere else (and back as well). The charts had lines on them called isochrones – joining points that were the same number of days out from, say, London en route to Cape Horn using different tracks. These lines bulged outwards along the tracks that gave the fastest passages at different times of the year, so the Germans, in particular the Laeisz Line (also known as the Flying P line because all their ships’ names began with a P – Preussen, Potosi, Parma, Pamir…), were able to direct all their ships to cross the equator going south at between 27 and 28 degrees west. As a result, their ships were able to make three voyages to Australia each year against everyone else’s two.
I want the isochrone charts from August to December for our return trip leaving Falmouth for Sydney in late August via the Cape of Good Hope. A signed ‘Berrimilla Around’ shirt for the first person who gives me a viable reference that I can use when we get to Falmouth. This almost certainly means that they must be accessible via the internet in some way. I tried to find them before we left Sydney but ran out of time. Might help if you speak German. The word has another more modern usage, for things occurring at the same time, and Google finds all these but none of the others.
These days similar information almost certainly lives in lots of computer databases – Whitbread races, Volvo and Vendee races, Dame E. ad all the others – but is now proprietary and anyway I think there’s something a bit special about using the older charts to plan the route.

 The logs ramblings can be cryptic, so we have added: